skip to main |
skip to sidebar
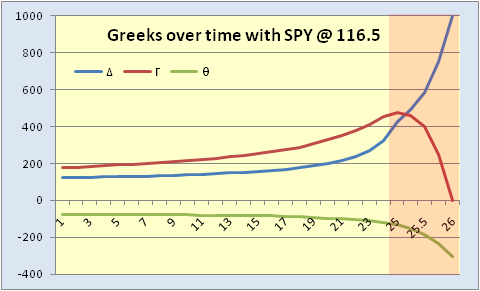
In the last post we saw how a long straddle can work in your favor when the stock moves around and you have taken a delta (∆) hedge approach. I also touched on the concept that as time passes ∆, gamma (Γ) and theta (θ) become larger in absolute terms for the near-the-money-options. In the case of the long straddle that we were examining, Γ evolves to a greater positive number, θ to a larger negative number, and ∆ to greater value depending on whether it is above or below the strike. I have included a chart of what approximately happens to the three Greeks in question if the SPY stays at 116.50 and implied volatility remains constant over the life of the contract. This represents day to day changes except for the shaded area at the right, which represents the last day of trading (expiration Friday). Since the SPY calls are in-the-money and the puts are out-of-the-money the straddle position finishes the cycle at +1000 ∆'s for the 10 contract position. A few things stand out: 1) Γ plunges on the final day to 0 because the options are either in-the-money or out-of-the-money, there is no in between, 2) θ's decline rate is also extremely rapid as the 4 PM bell approaches, in other words, although there may be some time value left at the opening , it diminishes rapidly as the day progress as a result of 3) the ∆ on each call option rapidly approaching 100 and the put ∆ approaching 0. Obviously, this scenario is unrealistic, but it exemplifies what is happening to each option over time which is important to understand with any option position.
It is the goal of the long Γ trader to have enough swings, up and down, over the life of the position to offset the continued loss of time value. In the process you buy low and sell high, again and again . . . at least in theory.
In the example provided in the last post, I chose a somewhat arbitrary 1.5% move in the SPY since the investment in the straddle involved a premium outlay of roughly 3% of the value of the underlying. More commonly, traders use some ∆ value as a reference to place their hedges; perhaps every 200-300 ∆'s. Whatever parameters you choose, the most important thing is to be consistent in your hedging. Also, hedging does not guarantee a profit since it is always possible that the underlying will not move sufficiently up and down or that it moves only in one direction. None the less, it is probably worthwhile to employ some sort of hedging methodology if you are going to trade a long straddle.
Finally, there is the consideration of implied volatility. If the stock is really not moving, then IV is likely to decline which will accelerate the option's rate of decay and negatively impact your position. On the other hand if the stock becomes extremely whippy the value of your position is likely to increase with IV up until expiration day when the options will ultimately approach values of 0 or parity. If the stock is whippy, however, there should be additional opportunities to flip the stock more frequently making it easier to cover the θ. Should IV really spike, you may also have the opportunity to close the position out on that move alone.
We will continue this discussion next time with a look at the risks of a short straddle.
Long overdue for this blog is a discussion of the Greeks. While I highly recommend a more detailed study for someone who is considering or has just begun trading options, this should provide a decent overview. For this example we will use the purest of volatility plays: the straddle, which involves either buying or selling the same strike and month call and put. Most option traders are familiar with this position and understand that there is considerable risk associated with it. Usually the choice is for the at-the-money options since this maximizes premium collection on the short side and provides the least expensive way to bet on significant movement in either direction on the long side. Break even calculations are fairly straight forward; strike price +/- total premium collected or paid.
Since both options ultimately decay to zero or parity, the holder of the short position wants the stock, or in this example the SPYs, to go nowhere over the holding period, whereas the holder of a long straddle wants the stock to move as far from the strike as possible in either direction. Simple enough, right? Wrong. As a side note, I chose the SPYs because the bid/ask spreads are narrow and in this case there was only a $.03 difference between buying and selling the straddle, however for most individual equities the spreads are much wider.
The probability of a stock or ETF (or whatever the underlying is) staying exactly in one place or moving strongly in only one direction is small, so one must consider hedging the position at some point. Before you can do this you must understand the Greeks. We talked about vega (v) in the discussion on implied volatility, now we need to consider delta (∆), gamma (Γ), and theta (θ). In the case of the long straddle, a position of 10 contracts of both calls and puts, the Greeks are 1) long 110 ∆'s (when I priced this example the SPYs were around 116.50 and implied volatility was around 14.5%, so the calls had 11 more ∆'s than the puts), 2) long 180 Γ, which means that for every $1 move higher the position will get longer by approximately 180 ∆'s and for every $1 move lower the position will get shorter by approximately 180 ∆'s, 3) short -$75 in θ, meaning that each day, as a result of time decay, the value of the straddle will decline by approximately $75, and 4) long 240 v, so that for a change of 1 point in implied volatility the position will gain approximately $240 in value if the move is higher or lose the same amount if lower. Of course all the Greeks are reversed for the short straddle and the reason I keep saying "approximately" is that as prices change and time passes these values change incrementally.
For the long straddle one must be aware of the vega since changes in implied vol also impact the other Greeks, but as a standalone position there is not much you can do about it as far as hedging. So the focus is on the other three. You can of course do nothing during your holding period and hope that the SPY finishes more than $3.57 (the total premium paid) away form 116, but many people opt to ∆ hedge. The most you can ever be long or short with this position is 1000 ∆'s (10 contracts * 100 shares per contract), but unless the SPYs gap largely in one direction or another, the straddle is likely to have no more than 700 ∆'s if there is any meaningful time left to expiration and that would still require a fairly significant move.
One approach to ∆ hedging is on a percentage basis. The straddle cost approximately 3% of the value of the index, so if you are actively hedging you might choose to flatten out on a 1.5% move as an initial threshold. Let's say that that move happens after holding the position for 3 days and the SPY is trading at 118.25. The Greeks are now: ∆ = +440, Γ = +150, and θ = -$72. The straddle is now worth approximately $3.85 (we are assuming constant implied vol for simplicity, although, as always, this may not be the most accurate assumption). Since we are ∆ hedging we decide to sell 440 SPY at 118.25. As you may know, if you are familiar with ∆, or may have guessed by reading this, one definition of ∆ is the hedge ratio and it tells us how much of the underlying we need to buy or sell to remain neutral to price direction.
After two more days the SPY dips to 116 and net of our short stock position we are short approximately 440 ∆'s, which we buy back and pocket $990, and the straddle is now worth approximately $310. We are again price neutral but our Γ has increased to +200 and the options are decaying at a net rate of $85 per day. These are two important points. As expiration nears and the stock stays near the straddle strike gamma increases along with the rate of decay (θ). Intuitively this makes sense because the closer we are to expiration the greater the probability is that the put or the call will finish with 100 ∆'s as they approach their terminal value of either zero or parity.
Obviously this is a discussion that is going to take more than one posting so we will continue this next time.
While I hoped to get into some volatility spreads today, I felt it might be valuable to cover basic short spreads first. This shouldn't take much time since we already discussed basic long spreads and they are after all the same thing. What? Yes you read that correctly: the most important thing to remember is that, given the same strikes, selling a call spread yields the same payoff function as buying a put spread and vice versa. Long time traders are well aware of this but it is a point that is frequently missed by less experienced option traders. I have included two charts 1) a short position in the 40-41 call spread and 2) a long position in the same strike put spread for the Retail SPDR (XRT). As you can see, they produce the same break even scenario based on a transaction that could have been executed bid to ask at yesterday's closing prices.
These spreads are perfectly aligned, as they should be, and emphasizes the point that when you subtract the cost of buying a call spread from the difference between the strikes, you should have the price you would be able to get if you sold the same strike put spread. Occasionally, you will find a situation where the options are out of whack, which might provide an astute trader who understands this relationship to find a little more edge in a trade. Of course if things become too skewed, someone, or more likely one of the many algorithms that are out there, is going to hit bids and take offers until it get back into line.
So the question becomes, why choose one over the other? Unless you can find a way to get a better price in one over the other, it makes absolutely no difference. Even when you consider the skew or smile of implied volatility in a given month, since the strikes are the same the implications of the two spreads are identical for shifts in volatility and over time. The XRT spreads used in the example are right at the money, but if you were using lower strike options (in-the-money calls/out-of-the-money puts) you might expect to find some advantage in buying the put spread as opposed to selling the call spread given a normal skew or smile, but if the market makers are doing their job, this simply isn't the case.
The bottom line is that if you are looking to buy a basic 1-to-1 be sure that you check out the other side of the board to make sure everything is in line, occasionally you might be able to save yourself a few pennies because some misalignments might be too small for an algorithm to capitalize on but could reduce your cost. A quick example: Say you are intending to buy a $5 call spread that is offered at $1.25, the put spread should be $3.75 bid, but maybe it is $3.80 bid. That translates into paying $1.20 for the call spread which is obviously a better choice for you. In today's world of electronic markets these things change quickly and it pays to be aware of your options (pun intended). Happy Friday!
A quick follow up on the Predictive VIX post:
I couldn't help noticing that on Monday, Tuesday, and Wednesday of last week that the VIX increased marginally (less than the 5% level that was examined in the original post) while the SPY also had marginally positive moves from close to close. So, since I have the data, I thought I might take a look at the occurrence of multi-day positive VIX and positive SPY over the March 1995 to present range.
Generally speaking, it proved to result in positive returns over the next 120 day period (there was no look back condition). On average, the SPY was approximately 4.2% higher 120 days from the event. However, results on a shorter 60 day forward looking period were much more mixed yielding an average return of 1.1% with a number of 1-3% down periods. In essence, there is the suggestion of a range bound market over the next 6 months.
So although the VIX is trading near pre-crash lows there is certainly the potential for it to continue lower since recent realized volatility in the SPY is considerably lower than the expectations reflected in the VIX. This would be consistent with a range bound market over the next 6 months. Additionally, as of last week, the market is still pricing in expectations of increasing volatility during 2010 (see Implied Volatility - Part 1), allowing the market a "wall of worry" on which to climb.
It should be noted that there were 3 multiple up/up events that produced significantly negative returns over 120 day periods: 1) late August 2000, while the in the throes of pricing in a bursting internet bubble, producing a -16% return, 2)December 2007, as the market began falling from its peak, yielded a -10% return, and 3) May 2008, when the crisis was really beginning to take its toll, resulting in a -36% return. Those were clearly unusual periods and current market conditions do not really resemble those times. Basically, it seems likely that the broad market is likely to find itself up or down 3-5% over the next 6 months with decreasing volatility. That is hard for me to say because I personally believe that there are a number of factors that could negatively impact world markets during 2010, but the numbers suggest that if there is an impending disaster on the horizon, it may take some time to surface.
Oh and HAPPY ST. PADDY'S DAY!
Now that we have taken a look at some generalized expectations for implied volatility over time, we can reexamine how that impacts the buying of basic spreads. In both cases, we were purchasing the near-the-money option and selling the next strike up or down.
The first thing that is likely to come to mind is that when you buy a put spread you are capitalizing on the implied vol skew by purchasing the lower implied vol options and selling the higher. Hopefully, this will help reduce the cost of the hedge or bearish bet. In the CGX spread which was hypothetically initiated on March 5, with 43 days to April expiration, there was a theoretical skew in implied volatility between the 40 and 45 strikes. Unfortunately due to the wide markets, most of that was sacrificed in the bid/ask spread and this is not an uncommon occurrence in less liquid options. In other words from the perspective of the initiator, the skew is difficult to capture but still allows for some improvement in net outlay. The stock has been as high as $48.48, since the trade and today hit a low of $44.55 with implied vol holding fairly steady in the mid 40s. If the stock had held near its recent high then IV would likely be diminished exacerbating the losses accruing as a result of adverse price action and time decay. In other words, the probable downside parallel shift across IV in the April strikes is an additional negative factor to the position. Should price action be favorable (the stock declines), if it is not rapid enough, then it is possible for potential gains to be offset by time and a potential decline in implied vol. However, if it is quick, then the position has the potential to benefit from an increase in IV as well as the favorable price action.
Compare this to the hypothetical call spread purchased in CMI. Given the same expectations regarding the skew of the strikes in April (IV decreases as strike price increases), not only do you end up selling an option with a lower implied volatility than the one purchased, but IV may work against you even if the price heads higher. Barring takeover speculation, a stock that moves higher is more likely to see declining IV levels. When you combine this with the adverse effects of the passage of time, it is possible that you could be breaking even or making a small loss even if you are right directionally. On the other hand, an increase in IV levels that is probable with a quick decline in a stock's price is unlikely to offset losses associated with the adverse price action.
In sum, favorable price action is likely to favorably impact a long put spread in terms of implied volatility, but act as a small detriment to a long call spread position. In both cases, as with any long option position, time will be working against you both in terms of decay and as skew becomes a smile. Once again, I feel it is important to emphasize that changes in implied volatility are only tendencies and are ultimately driven by supply and demand factors, but it is important to bear these points in mind should you choose to initiate this type of position.
While I intended to discuss the impact of implied volatility and time on the strategies we have talked about so far, I felt that some general information on implied volatility might be useful to cover first. I have included a chart that depicts estimated implied volatilities for near-the-money strikes on the SPY. These are the average of the call and put implied vols for the available 2010 months (LEAPS are not shown and there are many more strikes available in each month). What stands out is that the March values exhibit the classic "volatility smile" indicating that the nearest-the-money strikes are "cheapest" while the out-of-the money strikes are significantly more expensive. The April values are beginning to "smile" but still have significant skew, like the further out months. Skew in this case is characterized by higher volatilities in the downside options with the implied volatilities diminishing as the strike prices increase.
To understand this it is important to grasp what implied volatility represents. In theory, implied volatility reflects future expectation of the underlying's actual volatility. In an aggregate sense this is true in that if implied volatility is rising across all strikes then the market is pricing in expectations of increasing actual vol; if it is lower across the board then actual vol is expected to be lower over time. Implied volatility is really, however, a "fitting" of the volatility component of a theoretical options pricing model. In other words, based on supply and demand factors as well as time to expiration, market makers adjust their implied vols to reflect fair value or the approximate mid-point of a given option's bid/ask spread.
You might ask, "What's the difference?" An aggregate metric like the VIX can be used as a general measure of expected volatility (at least over the next 30 days), but the "fitting" of the volatility component is what causes smiles and skews to exist. Longer dated option trading (beyond the front two months) tends to be dominated by hedging, selling covered calls or buying protective puts, thus a downward sloping skew exists. As a given expiration approaches, however, a smile begins to develop since the vega of the out-of-the-money options diminishes causing changes in an option's price to have a greater impact on implied volatility. Natenberg** defines vega as: "the sensitivity of an options theoretical value to a change in volatility", but the caluclation goes both ways. As an example, let's say that a near-the-money option is fairly valued at $1.00 and has a vega of .05 and an out-of-the-money option is valued at $.20 with a vega of .01. Assuming no change in the underlying, if both options increase in value by $.05 then the implied volatility of the first option increases by 1 point, whereas the IV of the second option increases by 5 points. So as time passes and out-of-the-money options approach parity or zero, small price changes can dramatically impact the implied volatility of those options, thus the skew develops into a smile.
In addition to the time factor, order flows begin to change as expiration approaches. More speculators show up in the front two months looking to profit from a quick move in either direction, causing out-of-the-money demand and thus implied vol at those strikes to rise. Also, hedgers who were selling further out calls are now buying those calls back and selling new longer dated calls. For some reason, people are less likely to sell out their put protection, but that is another story.
In sum, over time it is reasonable to expect skew to become a smile. Is this a hard and fast rule? No, because option markets, like the underlyings they are derived from, are fluid. None the less, these points are good to keep in mind when considering the appropriate time to expiration and strike of a potential options position.
Hope I didn't cause too much confusion by getting overly technical today and I will start discussing the impact on strategies very soon.
**Sheldon Natenberg, Option Volatility& Pricing.
One thing that I neglected to mention in the last post (Buying Basic Spreads - Part 1) about hedging by buying a put spread is that you can use similar strategy if you are short the stock but instead buy a call spread to protect yourself against a short term spike if your longer term outlook for the stock is bearish. However, and this leads to the next topic, you could also purchase a spread to capture short term moves in a speculative sense. Obviously either bullish or bearish speculative positions can be established by purchasing call or put spreads respectively. In my opinion, this can be a great strategy for swing traders. In other words, and this is heavily dependent on your particular broker's margin requirements and your risk parameters, you might be able to significantly leverage your opinion by purchasing a basic spread for several days or weeks as compared to purchasing or shorting a stock.
For this example we will take a look at Cummins Inc (CMI), which, although finishing down on Monday, is trading at levels not seen since September 2008. Again, strike selection is highly dependent on expectations of movement and the time frame that that movement might occur in. Let's assume that your expectations are for continued strength over the next month and a half. While you have a number of choices as far as strikes are concerned, since the stock has $2.50 strike intervals up to $65, we will examine the 60-65 and 62.5-65 call spreads.
The former could have been purchased near yesterday's close for $2.00 and the latter for $.85 (as always assuming a bid to ask transaction with no price improvement). In both cases your maximum loss is limited to premium paid and the maximum gain is capped at the difference between the strikes less premium paid or $3.00 and $1.65 respectively. After our usual assumption of 2 weeks passing and implied volatility remaining unchanged, should the stock drop to $57 the spreads would be theoretically be worth $.52 and $.26. On the other hand should CMI rise by $3 over the period, the theoretical values would be approximately $2.65 and $1.11 respectively. While assuming an unchanged level of volatility is not necessarily a reasonable expectation, it serves to help understand the price and time impact on the value of the options. Also, and this is why I mention basic spreads as a choice for swing traders, if you are long and wrong and the stock is at $57 and decide to close the trade you have lost $1.48 on the 60-65 spread compared to the $3.00 which that would have been lost if you were long the stock. On the other hand, if you are right you make only $.65 compared to $3.00 being long the stock. The point I wish to make with regard to short term trading is that, assuming a 50% margin requirement (margin being just another form of leverage and may vary depending on your agreement with your broker), you would have tied up $30,000 in capital on a 1000 share trade compared to $2,000 to own the spread 10 times. Because of the additional leverage, percentage gains and losses are also magnified, resulting in an approximate 75% loss on the down side in the spread versus a 10% loss from owning the stock. Contrast that to a 32.5% gain on the spread and a 10% gain on the stock should CMI move to the upside. Obviously, commissions, slippage and other factors may influence total return, but that is why this is an example. Additionally, I am not necessarily advocating for this strategy but it is worth a consideration if you engage in this type of trading. Like any form of speculation or investing you must be comfortable with the risks associated with a transaction and understand them fully.
One thing that we have not covered is the impact of changes in implied volatility over the course of time; we will take a look at that in the next post on the subject.
As you may have noticed there was a bit of a lag last week between posts. While I make no promises to update the blog daily, I will attempt to provide something new at least three times per week. Last week I slipped because I got distracted by some work I was doing on the VIX and the S&P, or more accurately the SPY which is a reasonable proxy for the index itself.
Anyone who has traded options for an extended period has sooner or later developed a theory regarding the predictive value of the VIX. Numerous papers have also been written on the subject evaluating returns on the S&P 500 given certain conditions in the VIX that may indicate a peak or trough in the market. After all, the VIX tends to move in an opposite direction from the market, rising during uncertain periods as the market moves lower and falling during periods of calm as the market moves higher, so there should be some value. What is important to remember is that the future is not only dependant on present conditions but also on how the market got to its present state, as any technician will tell you. So the question might not be what does the VIX tell us about the future of the market, but rather when does it tell us about the future of the market.
One point that has been raised in the past surrounds unusual action in the VIX, in particular the impact of future returns when both the VIX and the SPY are higher on a given day. I followed this line of reasoning but examined only extreme moves higher, greater than 5%, in the VIX while the SPY was higher by any amount. Looking back to March 1, 1995, giving 15 full years of data, there were only 38 instances when the VIX was higher by 5% or more and the SPY was higher by any amount. While I expected these events to be turning points for the market, it turns out that these days tended to confirm trends.
If, when these up/up days occurred, the SPY was higher than it was 60 trading days earlier, then one would enter the SPY on the long side; if lower, then enter on the short side. In either case, the position would be held for 120 trading days (or roughly 6 calendar months) barring a contrary event. In the case of a confirming up/up day during the 120 day period, the holding period would be extended 120 days from the most recent event, again barring a contrary signal. Of the 38 up/up days that occurred during the period in question, 2 occurred within 60 days of the beginning of the data set and could therefore not be acted upon (although I plan on extending the starting point in the future) and 23 occurred during a holding period, thus extending the time in the market. The result was 13 tradable events with holding periods averaging 217 days on the long side and 131 days on the short side. Additionally, the average time out of the market between positions was 117 days. The results are included in the table below. Three points should be noted: 1) no interest for holding cash during the days out of the market was included in the calculation of cumulative return, but that would only serve to increase the final value, 2) no dividends received or paid (don't forget that you have to pay dividends when you are short) were included, in other words this is pure price action, and 3) this compares to the cumulative return on a long position in the SPY from March 1, 1995 through February 26, 2010 of 227.3922%, again without dividends included.
| Action | Price on | Date | Price | Period Return | Cumulative Return |
| CLOSE | CLOSE | 1/19/2010 | 115.06 | 17.8169% | 405.3056 |
| LONG | OPEN | 7/28/2009 | 97.66 | | |
| CLOSE | CLOSE | 3/20/2009 | 76.71 | 36.9317% | 344.0131 |
| SHORT | OPEN | 9/15/2008 | 121.63 | | |
| CLOSE | CLOSE | 2/28/2007 | 140.93 | 7.5719% | 251.2297 |
| LONG | OPEN | 3/16/2006 | 131.01 | | |
| CLOSE | OPEN | 3/16/2006 | 131.01 | -8.6499% | 233.5458 |
| SHORT | OPEN | 11/1/2005 | 120.58 | | |
| CLOSE | CLOSE | 3/28/2005 | 117.31 | 3.0391% | 255.6600 |
| LONG | OPEN | 10/5/2004 | 113.85 | | |
| CLOSE | CLOSE | 2/17/2004 | 116.17 | 19.5780% | 248.1194 |
| LONG | OPEN | 6/3/2003 | 97.15 | | |
| CLOSE | CLOSE | 4/29/2003 | 92.11 | 19.1876% | 207.4959 |
| SHORT | OPEN | 4/2/2002 | 113.98 | | |
| CLOSE | CLOSE | 4/23/2001 | 122.24 | 11.3432% | 174.0919 |
| SHORT | OPEN | 10/27/2000 | 137.88 | | |
| CLOSE | CLOSE | 9/8/2000 | 149.81 | 6.5808% | 156.3561 |
| LONG | OPEN | 11/16/1999 | 140.56 | | |
| CLOSE | CLOSE | 12/23/1998 | 123.22 | 12.4065% | 146.7019 |
| LONG | OPEN | 3/23/1998 | 109.62 | | |
| CLOSE | CLOSE | 1/12/1998 | 94 | 26.7872% | 130.5102 |
| LONG | OPEN | 11/19/1996 | 74.14 | | |
| CLOSE | OPEN | 11/19/1996 | 74.14 | -12.7605% | 102.9365 |
| SHORT | OPEN | 9/4/1996 | 65.75 | | |
| CLOSE | CLOSE | 7/29/1996 | 63.02 | 17.9929% | 117.9929 |
| LONG | OPEN | 6/1/1995 | 53.41 | | |
| | | Initial Investment: | 100 |
Since one cannot know that the up/up event has occurred until the close of business on that day, both long and short positions were established on the opening price of the day following the event. As an example, the first long position established on 6/1/1995 was the result of an up/up day on 5/31/1995. Also I have highlighted the two incidents of contrary indications that occurred within the initial 120 day holding period which, in both cases, this caused the closing of a short and opening of a long position on the given day's opening price. If a position was held to the termination of a 120 day or extended holding period, the closing price was used. Graphically, it looks like this:
Clearly not all highs and lows were caught and there were incidents, in some cases of both high volatility that led to in short term draw downs during the holding periods and entering on the same side of the market over various intervals. None the less, the results are interesting. I am in the process of examining the time leading up to the investment periods in more depth to discover what motivations might have existed to inspire extreme moves in the VIX despite positive days on the SPY, so there is likely more to come, but it might be interspersed with strategy discussions.
As a final note, the strategy currently suggests a cash position as we wait for the next up/up event.
Today we are going to begin talking about buying 1-to-1 spreads. These can be done as narrowly or as widely as you like and for nearly any time frame. What is nice about buying spreads is that your ultimate risk and reward is clearly defined on entry: the most you can lose is the premium paid, and the most you can gain is the difference between the two strikes less premium paid. While this strategy can be used effectively for short term, risk controlled speculation; it can also be used to reduce hedging costs.
In the latter sense, put spreads can bought in lieu of a straight put purchase if one is concerned about a near term pull back, i.e. you need a little insurance. Let's say you were fortunate enough to pick up Consolidated Graphics (CGX) sometime in the last year (the stock has more than tripled since the low last March) but you are still long term bullish. None the less the stock has had a tendency to return to its 50-day SMA every few months and you are concerned that that time may be coming. This is not a bearish call on CGX, but simply an example.
Yesterday's the stock jumped nearly 4% to close at $46.17. Volume has been very strong since the stock reported a second consecutive quarter of blow out earnings (at least relative to the average of the two analysts that Yahoo! reports as covering the stock) in early February. None the less, there has been a month of apparently strong accumulation. You might feel that interest may be starting to wane and would like a little protection for the short run. As always depending on your outlook, you might choose either March or April options. Since, in this case there are two weeks to March expiration and the 40 puts are no bid, we'll take a look at April. CGX's option markets are fairly wide and not very deep (there is a good probability of price improvement, but that is a discussion for another time) so we are stuck with the bid ask spread for argument sake. The Apr 45 Ps were offered near the close at $2.40 and the 40 Ps were $.65 bid; so you could purchase the spread for $1.75 rather than purchase the 45 Ps alone. Again, our hypothetical expectation is for a short term pull back with a longer term positive view. This provides us with a less expensive way to insure a long position understanding that the greater coverage, at higher cost, of an outright put purchase is sacrificed.
By using April options we have also bought some time, however, should the pull back occur sooner rather than later, it may be worth considering removing the position. For example, let's say that after two weeks have passed and implied volatility has remained uncharacteristically constant at approximately 43 while the price has descended to $41, the spread would now be worth roughly $3.00. Is this the target you had in mind as far as a pull back? Or is it worth holding a little longer to remain hedged for another dollar on the down side? Whatever your decision, should you hold the position through expiration you will receive an automatic exercise if the stock closes between 40 and 45, so be sure to close it out if you want to hold onto your stock. May sound obvious, but you would be amazed.
As I have moved through this explanation, I realize that it is difficult to cover all aspects of an example, so feel free to throw a question my way if you need further clarification or expansion on any of the posts. We'll continue to examine basic spreading next time.
Alright, this post should wrap up our discussion on the buy-write. We have taken a look at some of the considerations that should be made when the position performs optimally (the stock goes nowhere) and if the stock drops more than expected. Now what happens when the stock moves unexpectedly higher?
Remember that in break even analysis the buy-write has the same payoff function as a short put, therefore in an up move profits are capped at the strike price – stock purchase price + plus premium received. The hypothetical position was established by buying TPX at $27.42 and selling the Mar 27.5 call at $1.05 yielding a maximum profit of $1.13 for any price over $27.50 at March expiration. In a mild or severe downturn in TPX, it is likely that you will be able to collect most or all of the premium from the call and take a loss on the stock. One can think of this as a reduction in the basis price. In other words, if the stock does not get called away and you have pocketed the entire premium the net cost of the stock is now $26.37 ($27.42 - $1.05). While your accountant or the IRS may not see it exactly like this, it helps in understanding the impact of a rising stock.
At this point, after the hypothetical two weeks have passed, TPX is trading at $29.50 and there is just about a week left to expiration. Keeping implied volatility constant over the time, the calls are now theoretically worth $2.07 and the puts are worth $.07. Decision time. It seems highly likely that the calls are going to finish in the money, probably by more than you collected for the calls, so what are the choices? First, you could hold the position to expiration and allow the stock to get called away, pocket your 4% return and move on. You could do the same thing by closing out both sides of the trade prior to expiration. But what if you want or need to hold the stock position for a longer period than two weeks?
This is the tricky case because, and this is the important point, if you buy the call back you have raised your effective price whether you close out the calls and continue to hold the stock or you choose to roll the call out on the calendar. Let's say you are able to sell the Mar 27.5 call for $2.05 to keep things simple. You now have a basis of $28.42 ($27.42 + ($2.05 - $1.05)). This is fine if the stock continues higher and you keep rolling to higher strikes, but if and when the stock pulls back, the position will start losing money sooner. In other words, the profit from the synthetic short put can only be fully captured by closing both sides of the position. This is not to say that simply closing the call side of the transaction isn't the right thing to do (again that evaluation can only be made in light of your expectations for the stock), but the impact must be taken into consideration when managing a portfolio. A final note on this position, if the overall portfolio strategy is to continue to employ the buy-write, it may be worth considering an early roll (before the rising price eats up all of your premium) if you feel that the stock is likely to continue to appreciate. This can help mitigate the impact on your effective price.
Ok let's sum it up:
- Stock behaves optimally and doesn't move much. Pocket your premium, smile and do it again.
- Stock drops below your break even. If it is a long term position and the reasons you got into the stock (fundamentally or technically speaking) haven't changed, consider writing the next month out and receive some consolation in a lowered effective price.
- Stock soars above the short strike. Again depending on your outlook, you may want to roll the calls out or close the position down, but be aware that you have increased your basis and may start suffering losses more quickly on a pull back.
The purpose of this discussion was not to endorse or discourage the use of the covered call strategy, but to clarify its impact in different circumstances.
I'll be back with another strategy later this week.