Showing posts with label the greeks. Show all posts

Wednesday, April 7, 2010

The Straddle, Volatility Plays and the Greeks – Part 3


At long last, the short straddle discussion is here. Originally a theoretical short position in the SPY Apr 116 straddle could have been established in late March for a credit of $3.54, providing expiration breakeven prices of 112.46 and 119.54. Since the original trade date on March 23, SPY spent several days in the 116-118 range before pushing above 119 yesterday. So the position is dangerously close to being a loser come April expiration and more importantly is already a paper loser. Fortunately, implied volatility has declined and time has passed, both of which work in favor of the short straddle holder. So let's compare some of the changes in the approximate Greeks then and now.


SPY Apr 116 10 Contract Straddle
Value
Delta
Gamma
Theta
Vega
Mar. 23 (SPY @ 116.5)
$3540
-110
-118
+$72
-240
Apr. 7 (SPY @ 119)
$3660
-673
-130
+$81
-120
Apr. 7 (If SPY was @ 116)
$2510
-30
-248
+$114
-150


The position is showing a paper loss of $120 and the short delta (∆) exposure has increased considerably as the calls have moved deeper into the money. The fact that the calls are roughly 2.6% in-the-money, has a limiting effect on gamma (Γ), theta (θ), and vega (v) which can be seen when compared to their respective theoretical values if SPY was closer to the strike. Generally speaking as stocks move further from the strike and expiration approaches, ∆ becomes more important than the other Greeks.

Managing ∆ risk also becomes increasingly important. Ideally of course, one does nothing and the stock returns to close right at the strike. However, most people tend to get a little nervous and choose to manage the ∆ risk to at least some extent. Unlike the long straddle position, where you buy low and sell high, the short straddle requires you to buy high and sell low if you want to remain ∆ neutral. You might ask why anyone would want to do that; because you are getting paid to assume that risk in the form of θ. Over the life of the position, the losses incurred from the buying high and selling low are hopefully more than offset by the declining value of the straddle. Like the long position, most traders use a mechanical approach on a percentage move, net ∆ basis, simply flattening out at the end of the day, or some combination of those parameters.

For example, if you are using a net ∆ approach, you might choose to purchase SPY when you reached negative 200 ∆'s. This likely would have occurred last week with the ETF around 117. The method would have you purchase 200 shares of SPY at that level. Since the stock continued to move higher, you would have been short (net of the first purchase) 200 ∆'s around 118 and then bought 200 shares more. If the underlying starts moving lower, you may need to sell some of this stock out to maintain a net position no greater than +/- 200 ∆'s. In this scenario, let's say that SPY is back to 116 and purchases of 200 shares were made at 117 and 118 as well as a subsequent sale of 200 at 117. For argument sake let's assume that SPY dropped briefly below 116 today causing you to sell 200 at 115.80, but is now back to 116 and the position looks like the last row in the above table. What has happened? Not including transaction costs, hedging with stock has lost $440, but the value of the position has decayed by more than $1000, yielding a net paper profit of $570.

As you can see holding a short straddle position can be a nerve racking experience because of the counter-intuitive way that you need to hedge. However, given the stock movement in this scenario, had you been long the straddle, you would be down $570 even though you are buying low and selling high! Clearly, straddles in general are for the more advanced trader and transaction costs become very important.

On a final note, the example used here involves an ETF which are much less likely to produce a significant gap. So there is an additional word of caution when employing a short straddle with an equity as an underlying. A good example of that would be today's action in Monsanto (MON). The stock disappointed the street with this morning's earnings report and gapped down to $67.53 on the open from a close yesterday of $69.80. During the first hour and a half of trading, it has traded as high as $71.26 and as low as $67.25, but is recently trading around $68.90. Anyone, who was short the Apr 70 straddle is likely to be having a very stressful day. As always, trading carries risks, understand them before you initiate a position and have a plan for hedging or closing that position in all scenarios.

Thursday, March 25, 2010

The Straddle, Volatility Plays, and the Greeks – Part 2


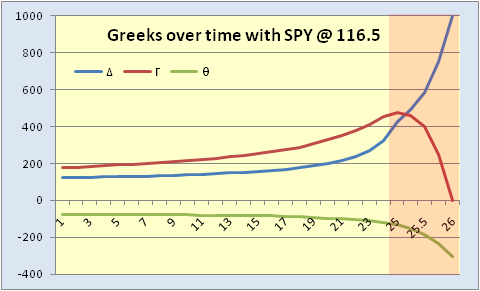
In the last post we saw how a long straddle can work in your favor when the stock moves around and you have taken a delta (∆) hedge approach. I also touched on the concept that as time passes ∆, gamma (Γ) and theta (θ) become larger in absolute terms for the near-the-money-options. In the case of the long straddle that we were examining, Γ evolves to a greater positive number, θ to a larger negative number, and ∆ to greater value depending on whether it is above or below the strike. I have included a chart of what approximately happens to the three Greeks in question if the SPY stays at 116.50 and implied volatility remains constant over the life of the contract. This represents day to day changes except for the shaded area at the right, which represents the last day of trading (expiration Friday). Since the SPY calls are in-the-money and the puts are out-of-the-money the straddle position finishes the cycle at +1000 ∆'s for the 10 contract position. A few things stand out: 1) Γ plunges on the final day to 0 because the options are either in-the-money or out-of-the-money, there is no in between, 2) θ's decline rate is also extremely rapid as the 4 PM bell approaches, in other words, although there may be some time value left at the opening , it diminishes rapidly as the day progress as a result of 3) the ∆ on each call option rapidly approaching 100 and the put ∆ approaching 0. Obviously, this scenario is unrealistic, but it exemplifies what is happening to each option over time which is important to understand with any option position.

It is the goal of the long Γ trader to have enough swings, up and down, over the life of the position to offset the continued loss of time value. In the process you buy low and sell high, again and again . . . at least in theory.

In the example provided in the last post, I chose a somewhat arbitrary 1.5% move in the SPY since the investment in the straddle involved a premium outlay of roughly 3% of the value of the underlying. More commonly, traders use some ∆ value as a reference to place their hedges; perhaps every 200-300 ∆'s. Whatever parameters you choose, the most important thing is to be consistent in your hedging. Also, hedging does not guarantee a profit since it is always possible that the underlying will not move sufficiently up and down or that it moves only in one direction. None the less, it is probably worthwhile to employ some sort of hedging methodology if you are going to trade a long straddle.

Finally, there is the consideration of implied volatility. If the stock is really not moving, then IV is likely to decline which will accelerate the option's rate of decay and negatively impact your position. On the other hand if the stock becomes extremely whippy the value of your position is likely to increase with IV up until expiration day when the options will ultimately approach values of 0 or parity. If the stock is whippy, however, there should be additional opportunities to flip the stock more frequently making it easier to cover the θ. Should IV really spike, you may also have the opportunity to close the position out on that move alone.

We will continue this discussion next time with a look at the risks of a short straddle.

Tuesday, March 23, 2010

The Straddle, Volatility Plays, and the Greeks – Part 1


Long overdue for this blog is a discussion of the Greeks. While I highly recommend a more detailed study for someone who is considering or has just begun trading options, this should provide a decent overview. For this example we will use the purest of volatility plays: the straddle, which involves either buying or selling the same strike and month call and put. Most option traders are familiar with this position and understand that there is considerable risk associated with it. Usually the choice is for the at-the-money options since this maximizes premium collection on the short side and provides the least expensive way to bet on significant movement in either direction on the long side. Break even calculations are fairly straight forward; strike price +/- total premium collected or paid.

Since both options ultimately decay to zero or parity, the holder of the short position wants the stock, or in this example the SPYs, to go nowhere over the holding period, whereas the holder of a long straddle wants the stock to move as far from the strike as possible in either direction. Simple enough, right? Wrong. As a side note, I chose the SPYs because the bid/ask spreads are narrow and in this case there was only a $.03 difference between buying and selling the straddle, however for most individual equities the spreads are much wider.


The probability of a stock or ETF (or whatever the underlying is) staying exactly in one place or moving strongly in only one direction is small, so one must consider hedging the position at some point. Before you can do this you must understand the Greeks. We talked about vega (v) in the discussion on implied volatility, now we need to consider delta (∆), gamma (Γ), and theta (θ). In the case of the long straddle, a position of 10 contracts of both calls and puts, the Greeks are 1) long 110 ∆'s (when I priced this example the SPYs were around 116.50 and implied volatility was around 14.5%, so the calls had 11 more ∆'s than the puts), 2) long 180 Γ, which means that for every $1 move higher the position will get longer by approximately 180 ∆'s and for every $1 move lower the position will get shorter by approximately 180 ∆'s, 3) short -$75 in θ, meaning that each day, as a result of time decay, the value of the straddle will decline by approximately $75, and 4) long 240 v, so that for a change of 1 point in implied volatility the position will gain approximately $240 in value if the move is higher or lose the same amount if lower. Of course all the Greeks are reversed for the short straddle and the reason I keep saying "approximately" is that as prices change and time passes these values change incrementally.


For the long straddle one must be aware of the vega since changes in implied vol also impact the other Greeks, but as a standalone position there is not much you can do about it as far as hedging. So the focus is on the other three. You can of course do nothing during your holding period and hope that the SPY finishes more than $3.57 (the total premium paid) away form 116, but many people opt to ∆ hedge. The most you can ever be long or short with this position is 1000 ∆'s (10 contracts * 100 shares per contract), but unless the SPYs gap largely in one direction or another, the straddle is likely to have no more than 700 ∆'s if there is any meaningful time left to expiration and that would still require a fairly significant move.

One approach to ∆ hedging is on a percentage basis. The straddle cost approximately 3% of the value of the index, so if you are actively hedging you might choose to flatten out on a 1.5% move as an initial threshold. Let's say that that move happens after holding the position for 3 days and the SPY is trading at 118.25. The Greeks are now: ∆ = +440, Γ = +150, and θ = -$72. The straddle is now worth approximately $3.85 (we are assuming constant implied vol for simplicity, although, as always, this may not be the most accurate assumption). Since we are ∆ hedging we decide to sell 440 SPY at 118.25. As you may know, if you are familiar with ∆, or may have guessed by reading this, one definition of ∆ is the hedge ratio and it tells us how much of the underlying we need to buy or sell to remain neutral to price direction.

After two more days the SPY dips to 116 and net of our short stock position we are short approximately 440 ∆'s, which we buy back and pocket $990, and the straddle is now worth approximately $310. We are again price neutral but our Γ has increased to +200 and the options are decaying at a net rate of $85 per day. These are two important points. As expiration nears and the stock stays near the straddle strike gamma increases along with the rate of decay (θ). Intuitively this makes sense because the closer we are to expiration the greater the probability is that the put or the call will finish with 100 ∆'s as they approach their terminal value of either zero or parity.

Obviously this is a discussion that is going to take more than one posting so we will continue this next time.